CAT Modeling and Wildfires
Co-authored by Taylor Daigle, Trenton Lipka and Scott Damery.
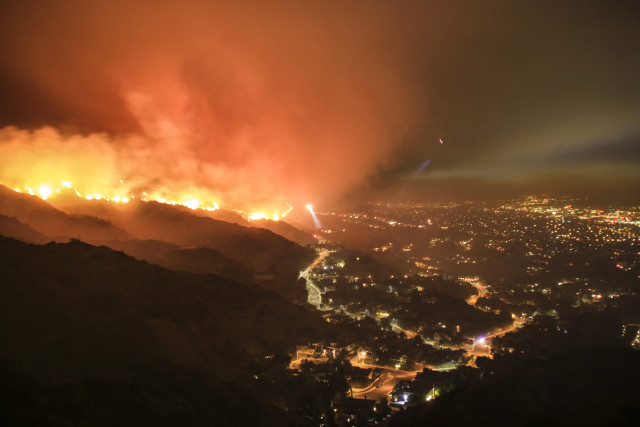
The 2018 news cycle was flooded with disturbing images of roaring fires in California. These wildfires were cataclysmic in scale and severity. Even more concerning is that the 2018 severe wildfire season was preceded by an awful 2017 season, which was the worst in recorded history until it was outdone by 2018. These events are troublesome and seem to be increasing in frequency. How can we in the risk management industry account for these seemingly worsening risks?
The first step in this problem, like every other actuarial problem, is to find a way to quantify what we are observing. However, this is more challenging than it seems. How do we quantify wildfire? Such an unpredictable force is nearly impossible to forecast using traditional methods. This problem mirrors one we have seen in the insurance community before. After Hurricane Andrew’s surprisingly destructive tear through Florida in 1992 insurers who did not become insolvent were left with a difficult question: How could they better predict losses resulting from hurricane exposures?
Their question was answered by a new take on an old strategy: catastrophe (CAT) modeling. 1992 marked a stark change in the way insurance companies began to prepare for CATs. Transitioning from in-house catastrophe divisions, independent modeling companies gained traction in successfully projecting the impact of Hurricane Andrew. AIR Worldwide used a probabilistic approach rather than historical and their methods greatly outperformed expectations during Andrew, accurately predicting losses in excess of $13 billion. Since then, CAT modeling has continued to change the way we plan for and mitigate risk on a large scale.
Hurricane Andrew was the first of two truly industry changing events. The second was the September 11, 2001 terror attacks. 9/11 changed the way the industry defined “catastrophe” and affected a new line of business prior CATs had not: workers compensation. This again shows us how singular events can change our definition of catastrophe and affect lines of business not previously associated with CAT exposure. The industry adapted to these events by constructing more robust CAT models that incorporated new factors and accounted for new classifications of risk.
These examples illustrate how transformative singular events can be and how the industry evolves. Industry adaptation, however, requires an event to be widespread and severe enough to trigger a strong reaction. The wildfires in California were certainly widespread but were they devastating enough to trigger an industry-wide reaction? A senior director at RMS, Chris Folkman, said, “The demand is incredible — and fully justified by carrier loss experience. Wildfire is now a major catastrophe concern, where multibillion-dollar event losses are not uncommon.”1 If demand is so great, what is being done to meet this demand? How are models changing after these wildfire seasons?
In order to understand what is changing with wildfire models, it is important to lay out how a typical CAT model functions. Generally, CAT Models rely on four main components: hazard, event, vulnerability and financial modules. The hazard module is responsible for assessing the level of physical hazard that a CAT event could cause to an area at risk. The vulnerability module then looks at the area’s structures and their contents. The event module takes data from the hazard and vulnerability modules and simulates thousands of potential CAT events. Finally, the financial module takes the thousands of simulated events and translates the physical damage into dollars.
An actuary’s role is to gather and input the most accurate data possible then quantify and interpret the results. Erroneous data is the downfall of any potentially useful model and that is why risk mitigation on this scale cannot be accomplished without multi-disciplinary assistance. It is crucial that actuaries continue to consult with meteorologists and data scientists to understand the environmental concerns and the means by which we analyze this ever-changing landscape. After gathering and validating this information, we must determine how to incorporate these results in our ratemaking or risk mitigation strategies. There are a variety of outputs commonly used. We have chosen to highlight the exceedance probability and average annual loss.
Exceedance probability is the probability that a loss exceeds a certain amount, usually returned as a curve. Exceedance probability is useful for a variety of things, particularly in making reinsurance decisions. When deciding at what point to attach a reinsurance treaty, it is important to have an accurate idea of your risk exposure. In turn, you must price exposures well within your appetite. Average annual loss (AAL) helps when assessing this latter point. The AAL is defined as the “expected loss per year, averaged over many years.”2 Mathematically, the AAL is the area under an exceedance probability curve. Insurance professionals use this metric when justifying the addition of new exposures or lines of business.
Now that we’ve laid some background information on the general components of CAT modeling, let’s look at some of the unique factors to wildfire models. The main difference between wildfire modeling and more “traditional” modeling is the input required. Wildfire is, by nature, unpredictable. Where and when a wildfire will spread is dependent on a number of environmental factors. Tracking these factors accurately requires advanced satellite imaging and detailed topographical maps of the wildland urban interface (WUI). The WUI, defined as the area where the wildland meets urban environments, was the focus of many model updates after the 2017 wildfire season.
The WUI can dramatically affect how quickly a fire spreads to insured properties. If well-maintained, some losses can be avoided altogether. The question now is how to assess if a WUI is well-maintained. It would be far too time consuming for an insurer to keep yearly tabs on the WUI near its exposures and extremely detailed topographical maps are difficult and tedious to construct. This harkens back to the need for high-quality and accurate data. As satellite imaging improves and becomes more readily available to insurers, we hope that more detailed topographical maps will also become accessible.
Even with the technological advances in data collection, models still face a huge problem – predicting human error. The majority of fires nationwide are started by humans (84%) and nearly all fires in California (95%) are man-made. Historically, fires have burned in the footprint of previous season’s fires, but the timing and point of origin differ from year-to-year. For example, the camp fire this past wildfire season burned over a footprint that contains 13 recorded fires since 1999. We may be able to identify zones more susceptible to wildfire damage, but accurately predicting their occurrence proves to be more troublesome.
In summation, CAT modeling has continued to evolve and change the way insurance companies and related entities prepare for disaster. While we feel that models have developed a tremendous amount since the 1990’s, it is important to remember that they are only one of the many tools in our risk-mitigation toolbox, one that should be used with great scrutiny.
References:
Taylor Daigle is an Actuarial Analyst with Pinnacle Actuarial Resources, Inc. in the Bloomington, Illinois office. He holds a Bachelor of Science degree in Mathematics with an Actuarial Science concentration from Louisiana State University. Taylor has experience in assignments involving Loss Reserving, Group Captives and Predictive Analytics. He is actively pursuing membership in the Casualty Actuarial Society (CAS) through the examination process.
Trenton Lipka is a Senior Actuarial Analyst with Pinnacle Actuarial Resources, Inc. in the Bloomington, Illinois office. He holds Bachelor of Science degree in Actuarial Science from Illinois State University. He has experience in assignments involving Loss Reserving, Group Captives and Large Data Processing. Trenton is actively pursuing membership in the Casualty Actuarial Society (CAS) through the examination process.
Scott Damery is an actuarial student attending Illinois State University. He is the current president of the Illinois State Actuarial Club and an active member of Alpha Phi Omega National Service Fraternity. Scott has internship experience with Pinnacle, working on reserving and ratemaking for Group Captives. He also has experience in various case studies regarding CAT modeling and rate indications.


