
Top 10 Auto Physical Damage Cost Drivers
The cost of repairing and replacing private passenger vehicles has accelerated substantially since the onset of the pandemic in March 2020. It is arguable whether or not there is a cause-and-effect relationship with the pandemic, but the higher costs associated with automobile repair or replacement are undeniable.
According to ISS/ISO/NISS Private Passenger Fast Track Data, the average cost per claim for property damage (PD) liability and collision coverages rose 12 to 18% since the onset of the pandemic. Prior to that time, annual increases in the cost per claim was in the range of 4 to 5%.
The 10 most significant cost drivers impacting higher costs for auto physical damage (APD) coverages include:
- Supply chain
- Higher speeds on roadways
- Distracted driving
- Electronics
- Electric vehicles
- Prosecutorial priorities
- Dynamics in the used car market
- Changes in salvage yard business practices
- Total loss thresholds
- Weather
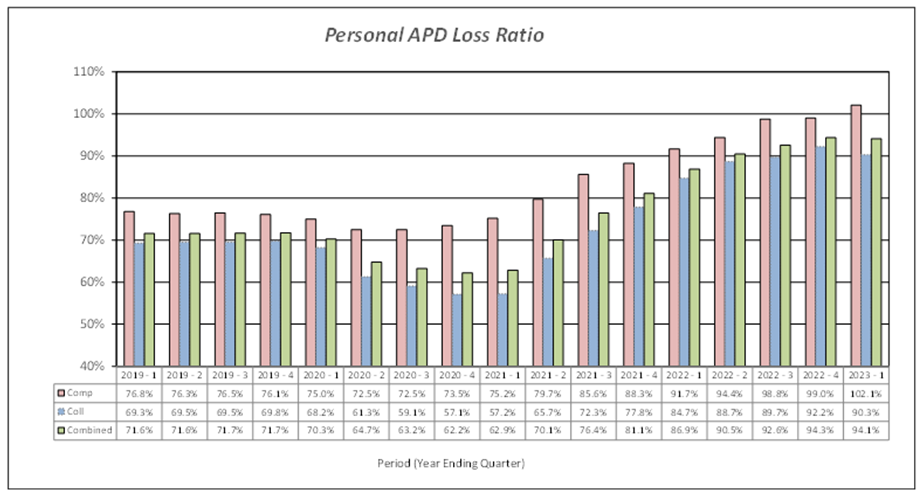
Insurance companies reaped substantial profits in 2020 as a result of a dramatic reduction in miles driven at the outset of the pandemic. In fact, using data from the NAIC Profitability Report by Line by State, the calendar year APD loss ratio dropped approximately 8 points from 71% to 63%.
Unfortunately, that drop reversed itself and the industry had two of the worst years from a profit perspective in 2021 and 2022. According to data reported to ISS/ISO/NISS Fast Track, the APD loss ratios climbed by 19 points in 2021 and another 13 points in 2022.
Loss ratios in the first quarter of 2023 appeared to have leveled off:
Accordingly, most carriers are implementing upward rate adjustments at a brisk pace. These increases may be seen first-hand in many households.
An analysis of each of the top 10 APD cost drivers indicate some important trends and underlying issues:
1. Supply Chain issues involve not just delays in obtaining parts and computer chips to repair vehicles, but also shortages in the labor pool to perform repairs. Associated with these particular delays are higher costs relative to the need for rental vehicles. In many instances, the length of time needed for repairing vehicles results in claimants bumping up against policy maximums for the cost of temporary replacement vehicles. Average backlogs at repair shops had typically been two weeks or fewer prior to the pandemic. Subsequently, those backlogs approached a full month. Reports indicate that repair shops have turned away tow trucks with damaged vehicles due to the lack of both parts and labor.
2. Higher Speeds on the roadways became evident at the onset of the pandemic. While the number of accidents was substantially down in 2020, the average severity resulting from vehicles traveling at higher speeds led to more serious injuries and higher fatality rates. Unfortunately, higher fatalities were more prevalent for pedestrians, bicyclists and other personal transportation devices such as scooters.
3. Distracted Driving has been an issue for many years, but the distraction rates increased during the pandemic, coincident with fewer drivers on the road. According to telematics providers, the incidents of distracted driving increased 30% in the 3 years ending 2022. According to data from Cambridge Mobile Telematics, drivers spent more than two minutes every hour interacting with their phone in 2022, up more than 20% since 2020.
4. Electronics – Automated driving, emergency braking, pedestrian/cyclist detection, infotainment and navigation systems (collectively, advanced driver assistance systems or ADAS) are just a few of the features being offered in newer cars. More and more computer chips are embedded in the systems on newer vehicles. Naturally, high-cost electronics are more costly to repair or replace and the availability of such are prone to disruptions in the supply chain.
5. Electric Vehicles (EVs) – The proportion of EVs in the market has risen substantially in the past several years. Reports indicate sales of EVs are projected to equal sales of internal combustion engine (ICE) vehicles by 2030, and to surpass them in the subsequent 10 years. The replacement cost of batteries for such vehicles are substantial and are subject to substantial delays due to supply chain issues.
6. Prosecutorial Priorities – The changes in attitudes on the part of public authorities to vigorously prosecute crimes of auto theft and other property matters coincides with a dramatic surge in such crimes. According to the National Insurance Crime Bureau (NICB), over one million vehicles were stolen in 2022, a 7% increase from the prior year. Data for mid-year 2023 by the Council on Criminal Justice indicates car thefts in the first six months of the year are up more than 100% from the same time period in 2022. The report does not attempt to link the phenomenon with changes in prosecutors’ priorities, however this seems to be a very real possibility..
7. Used Car Market – The surge in demand for vehicles during the pandemic was spurred, in part, by supply chain issues coincident with the onset of the pandemic in 2020. This supply of new vehicles was constrained by cutbacks and/or closure of assembly plants, bidding up the price of both new and used vehicles. This resulted in higher costs of repairing and replacing damaged cars. The demand surge for used cars was acute during the early years of the pandemic. The cost of rental vehicles surged as well. Online purchasing options proliferated as well, providing consumers the opportunity to comparison price shop.
8. Salvage Yards – Reports indicate sizeable increases in fees paid by insurers to salvage yards for towing, entry and storage. In fact, fees subsequent to the pandemic were up more than 50%. At the same time, cars are sitting on storage lots longer after the initial tow from the scene of the accident due to backlogs at repair shops.
9. Total Loss Thresholds – The percentage of total loss claims has risen steadily in the five years ending 2021 (the latest year for which data was provided by LexisNexis), up to 23% in 2021 from 17% in 2016. This trend is likely related to insurer claims handling practices of declaring total losses at lower thresholds. That is, a 70% to 80% threshold has commonly been used to determine constructive total loss. Each state sets its own minimum threshold (Texas has a 100% threshold), but insurers may use a lower amount. The common total loss formula is to add the cost of repair and the salvage value to the vehicle’s actual cash value (ACV). Given the surge in both the cost of repair and salvage values, the threshold of such to the car’s ACV is dropping, hence more total loss claims.
10. Weather – In the past several years, harsh weather has had a demonstrable impact on insurance costs. Wildfires, record rainfall, hurricanes, tornadoes and old-fashioned hailstorms all contribute to the frequency and cost of repairing vehicles.
The cost of repairing and replacing damaged and stolen vehicles has risen dramatically in the past few years and a perfect storm of causes have contributed to this phenomenon. Much uncertainty remains as to future trends in APD costs, but perhaps we may all consider higher costs as a new normal.
News & Insights

What Recessions Reveal About Property and Casualty Insurance Dynamics

How the Insurance Industry is Navigating the Complex Debate Over Fairness in Pricing

Keeping It Clean: Understanding Pollution Liability Insurance and Its Future
